Debugging with Visual Studio Code
In this guide you will configure and use Visual Studio Code to debug the FrontPanel Alloy PipeTest application found in the Samples provided with the FrontPanel SDK.
Install Prerequisites
- Visual Studio Code – Visual Studio Code – Code Editing. Redefined
- FrontPanel Application version 6.0.0 or greater
- PipeTest Sample bitfile for your device – Opal Kelly Pins
Open the project in Visual Studio Code
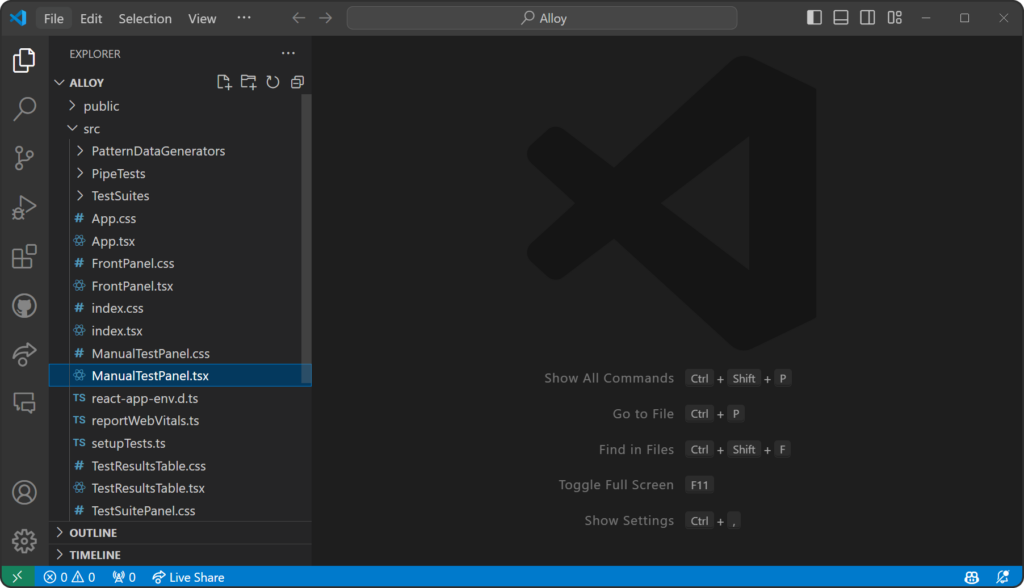
Launch Visual Studio Code and select the File->Open Folder option from the menu.
Navigate to the folder where the FrontPanel SDK samples are located and open the Samples/PipeTest/Alloy folder.
Build the project
Open a new terminal and install the application’s dependencies then build the application.
npm install
npm run build
Create the Launch Configuration ‘launch.json’ file
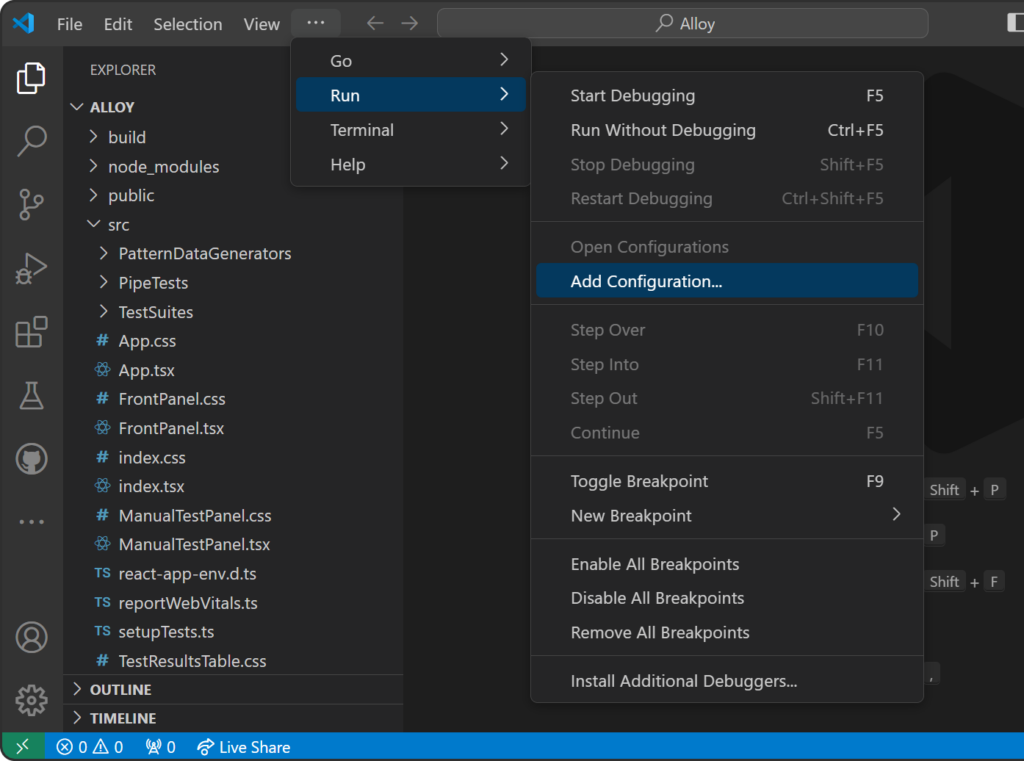
Select the Run->Add Configuration… option from the menu.
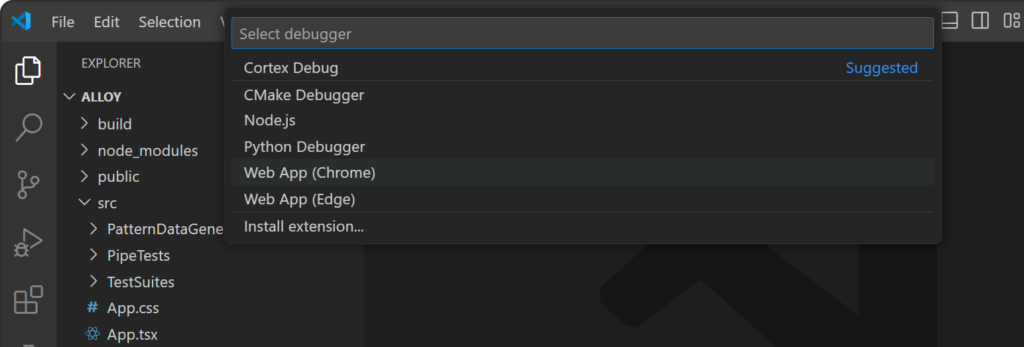
Select the ‘Web App (Chrome)’ option from the list of configuration types to add.
Verify that a new directory named ‘.vscode’ was added to your project and that a ‘launch.json’ file is present in this directory.
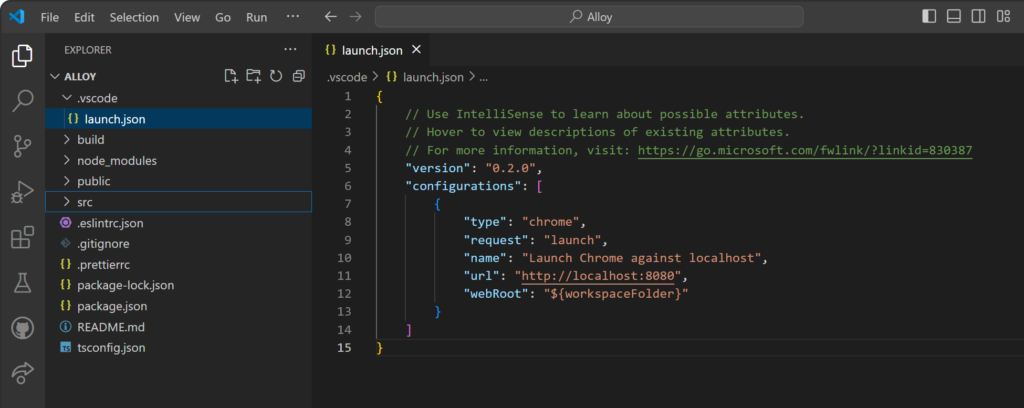
Update the Launch Configuration
Open the ‘launch.json’ file and edit the contents to look like the following:
{
    // Use IntelliSense to learn about possible attributes.
    // Hover to view descriptions of existing attributes.
    // For more information, visit: https://go.microsoft.com/fwlink/?linkid=830387
    "version": "0.2.0",
    "configurations": [
        {
            "name": "Attach to FrontPanel App",
            "port": 9223,
            "request": "attach",
            "type": "chrome",
            "sourceMaps": true
        }
    ]
}
Code language: JSON / JSON with Comments (json)
Start a local webserver
npm start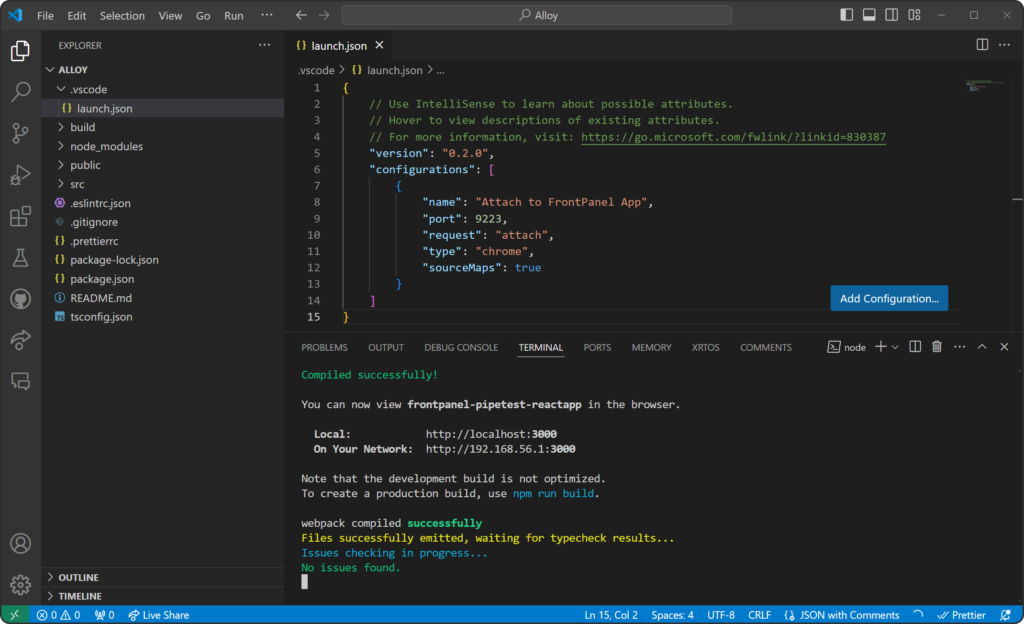
This will start the local development webserver to provide the application so that it can be debugged. The URL for the application is http://localhost:3000.
Start the application with FrontPanel
Launch the FrontPanel application and load the ‘pipetest.bit’ file then click the Load Profile button.
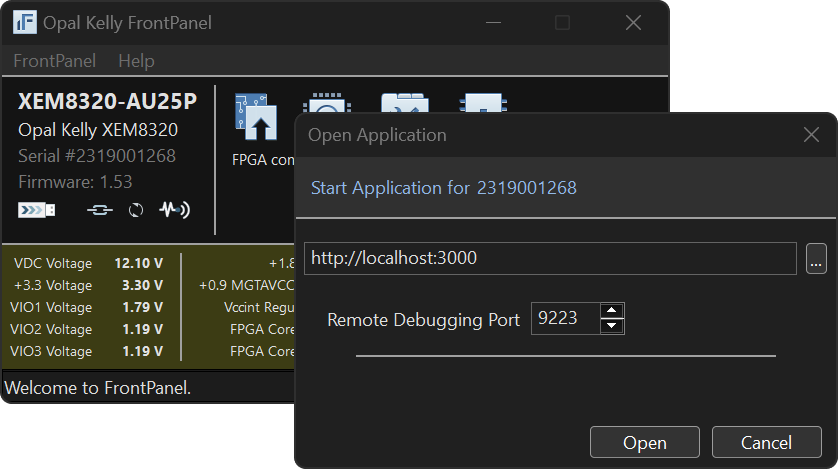
In the Open Application dialog, enter http://localhost:3000 in the text field and set the Remote Debugging Port to 9223. Then click the Open button.
Attach the debugger
Select ‘Run and Debug’ from the column of buttons on the left. (Ctrl + Shift + D)
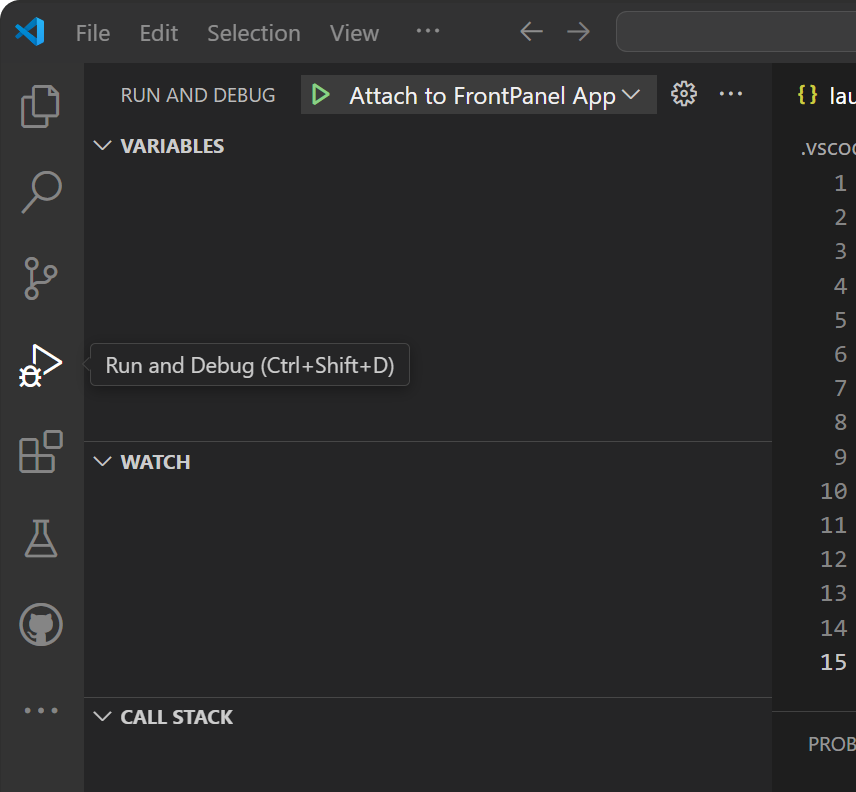
Select ‘Attach to FrontPanel App’ from the list.
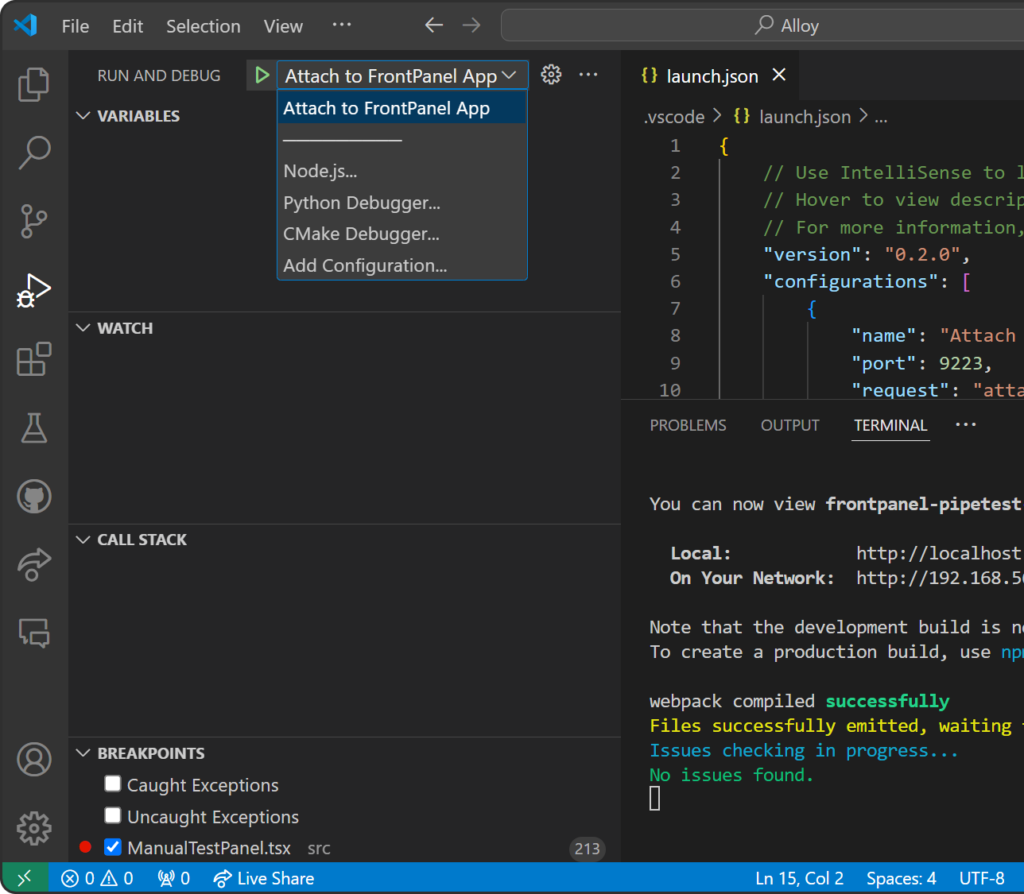
Start debugging by clicking the green play button. (F5)
Add a breakpoint
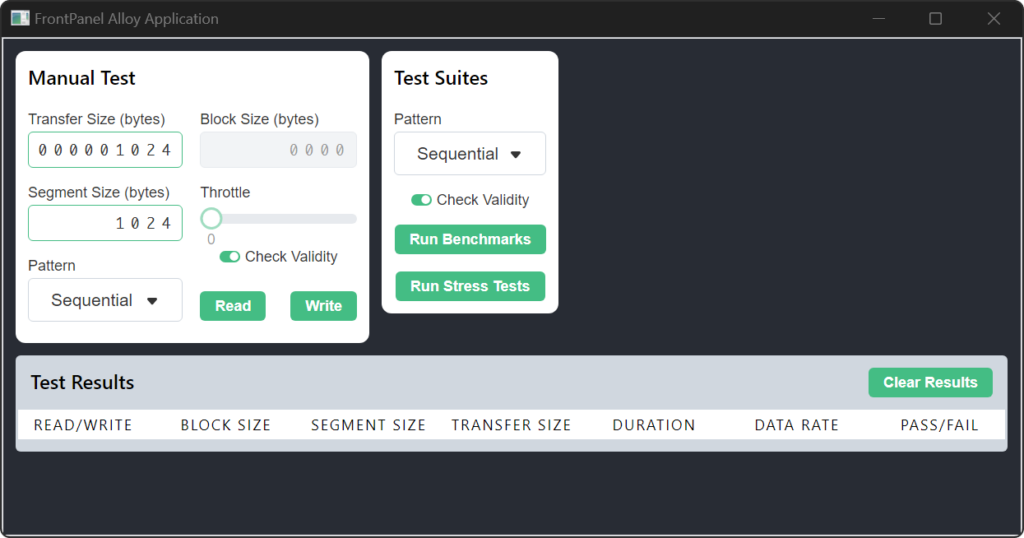
Open the ‘ManualTestPanel.tsx’ file and add a breakpoint in the PerformReadTest() function.
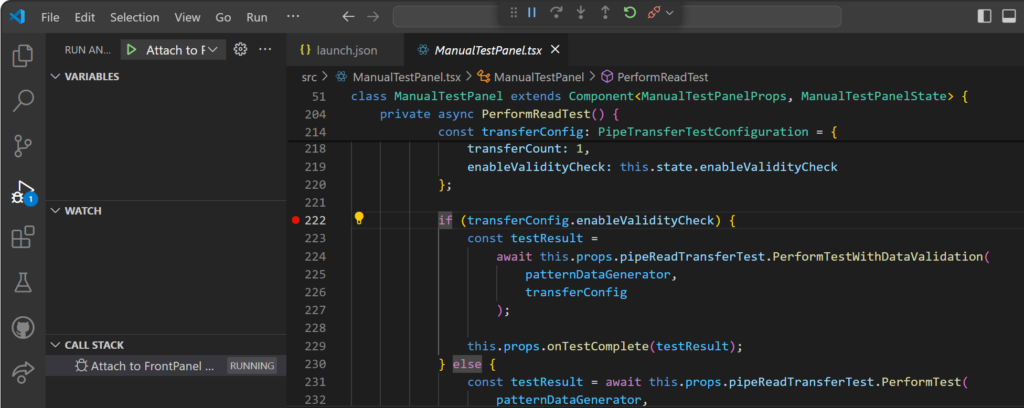
Click the Read button in the Manual Test panel of the PipeTest application user interface.
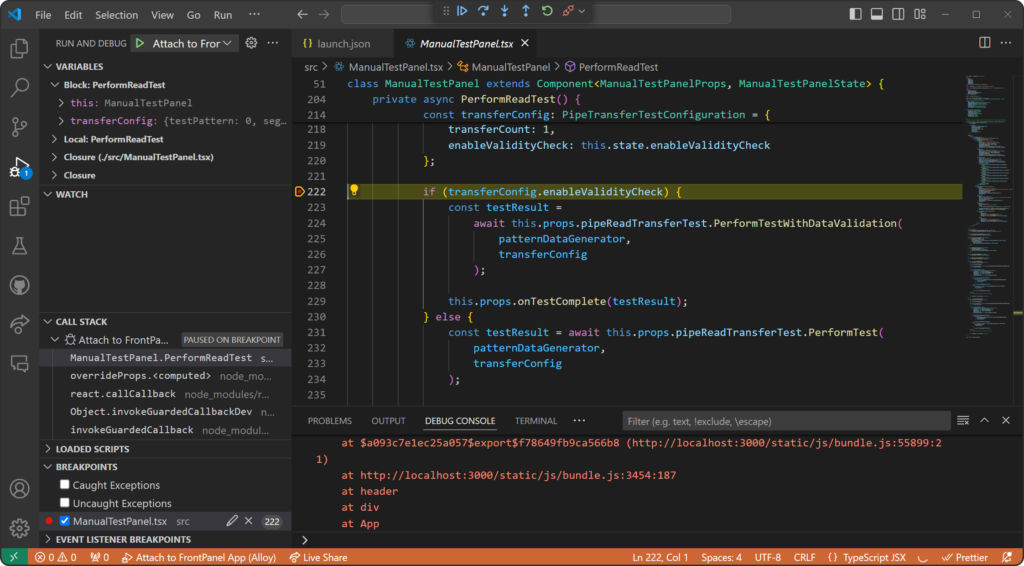
Application code execution should have stopped at the line with the breakpoint and the current state of the call stack and variables should be displayed.